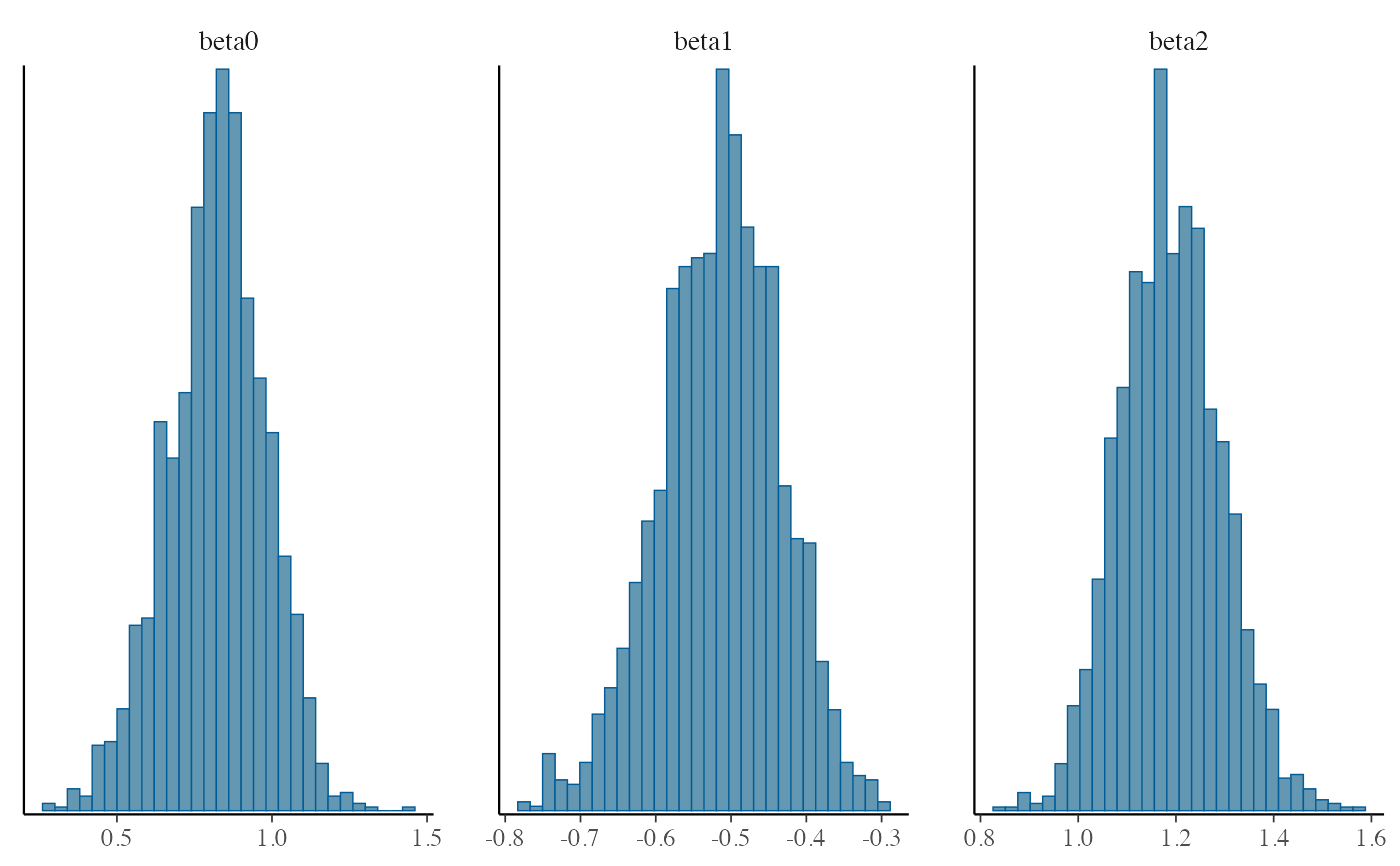
Plot Histograms of the Posterior Distribution
plot.hmclearn.RdCalls mcmc_hist from the bayesplot package to display histograms of the posterior
# S3 method for hmclearn
plot(x, burnin = NULL, ...)
Arguments
| x | an object of class |
|---|---|
| burnin | optional numeric parameter for the number of initial MCMC samples to omit from the summary |
| ... | optional additional arguments to pass to the |
Value
Calls mcmc_hist from the bayesplot package, which returns a list including a ggplot2 object.
References
Gabry, Jonah and Mahr, Tristan (2019). bayesplot: Plotting for Bayesian Models. https://mc-stan.org/bayesplot/
Examples
# poisson regression example set.seed(7363) X <- cbind(1, matrix(rnorm(40), ncol=2)) betavals <- c(0.8, -0.5, 1.1) lmu <- X %*% betavals y <- sapply(exp(lmu), FUN = rpois, n=1) f <- hmc(N = 1000, theta.init = rep(0, 3), epsilon = c(0.03, 0.02, 0.015), L = 10, logPOSTERIOR = poisson_posterior, glogPOSTERIOR = g_poisson_posterior, varnames = paste0("beta", 0:2), param = list(y=y, X=X), parallel=FALSE, chains=2) plot(f, burnin=100)#>
